LIVE ON MAC APP STORE

DevBar

Ports. Git. Services. All of it — one menu bar icon.
Stop switching tabs to check what's running, what's broken, and what needs a push. DevBar surfaces your entire dev environment at a glance.

DevBar — Environment Monitor
3 active
:3000 node / next dev OPEN KILL
:8080 python / uvicorn OPEN KILL
:5432 postgres OPEN KILL
2 need attention
~/projects/devbar ↑ 2 ahead
~/projects/site 3 modified
~/projects/scripts clean
all operational
GitHub 12 ms
Vercel 28 ms
Cloudflare 9 ms
3-in-1
Tools unified in one menu bar icon
$0
Subscriptions. One-time purchase.
100%
Native Swift. No Electron, no web views.
0
Cloud dependency. Runs entirely on your Mac.
Features

Three tools.
One icon.

01 
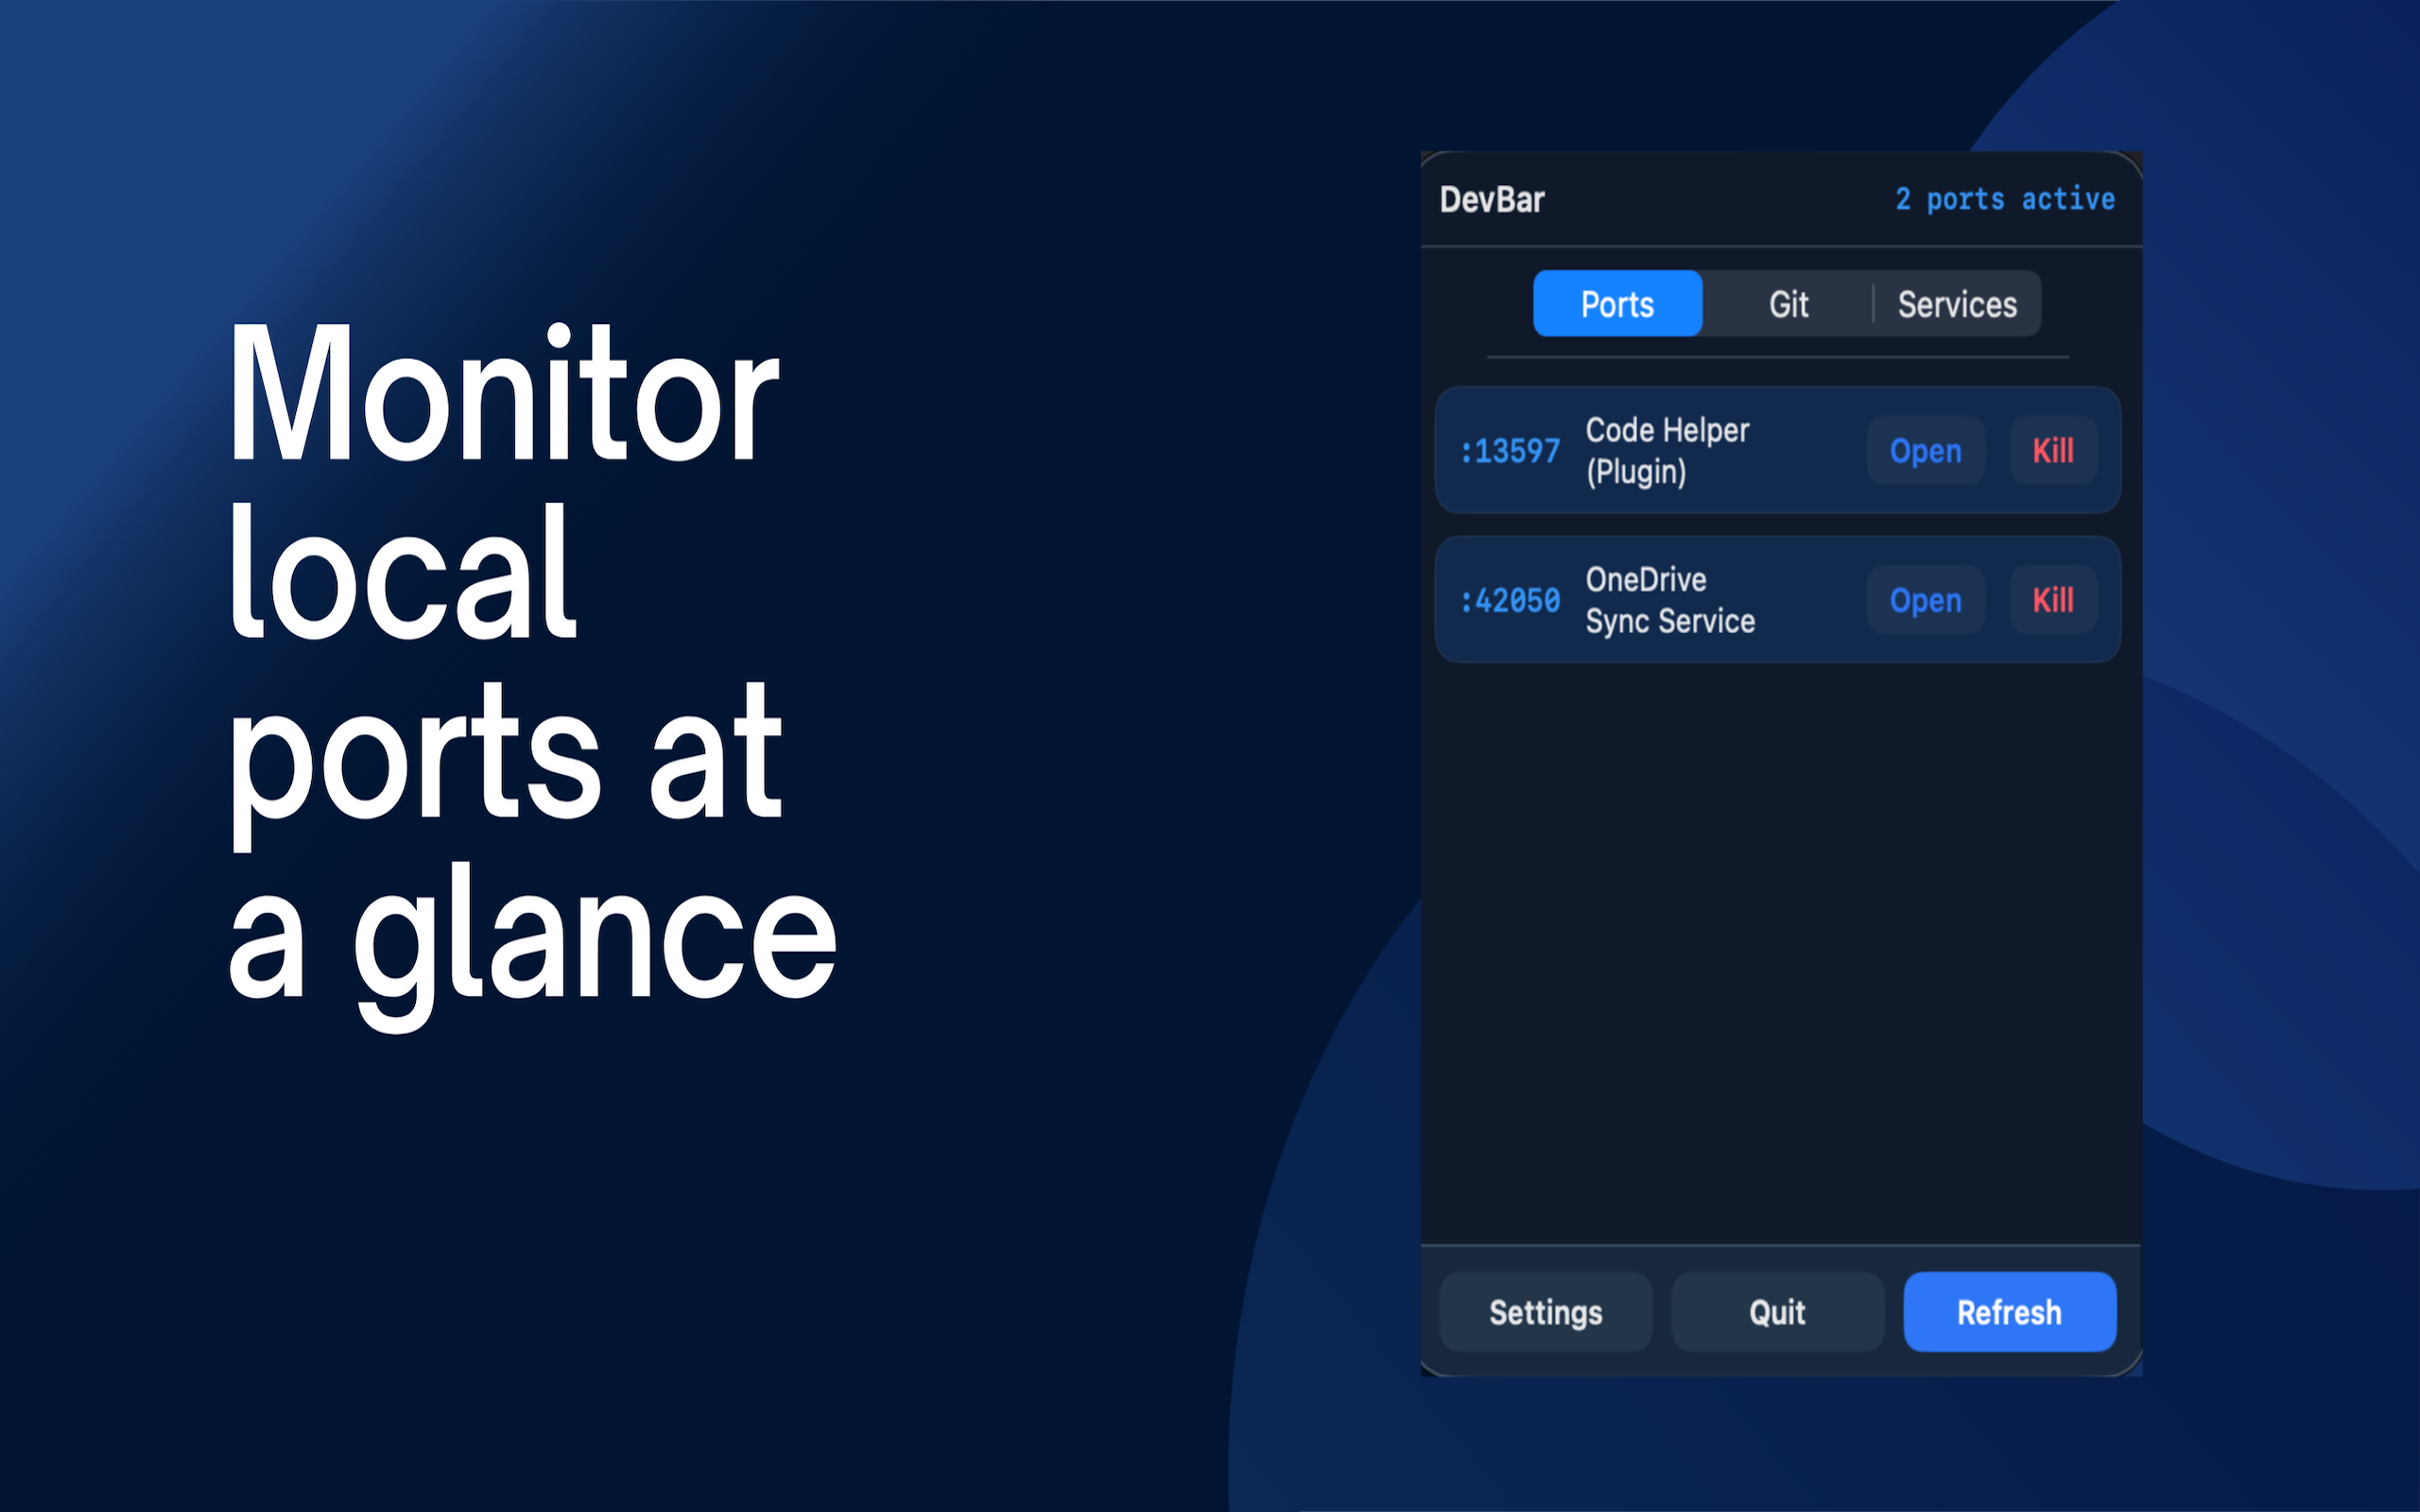
Localhost Port Scanner REAL-TIME

See every active port on your machine at a glance. DevBar continuously scans and surfaces the process name, PID, and protocol for each listener — so you always know what's running, and what's left running by accident.

  • Live scan — updates every few seconds
  • Kill a process without opening Terminal
  • Open localhost:PORT directly in the browser
  • See the process name, not just the port
  • Color-coded by status
DevBar localhost port scanner
02 
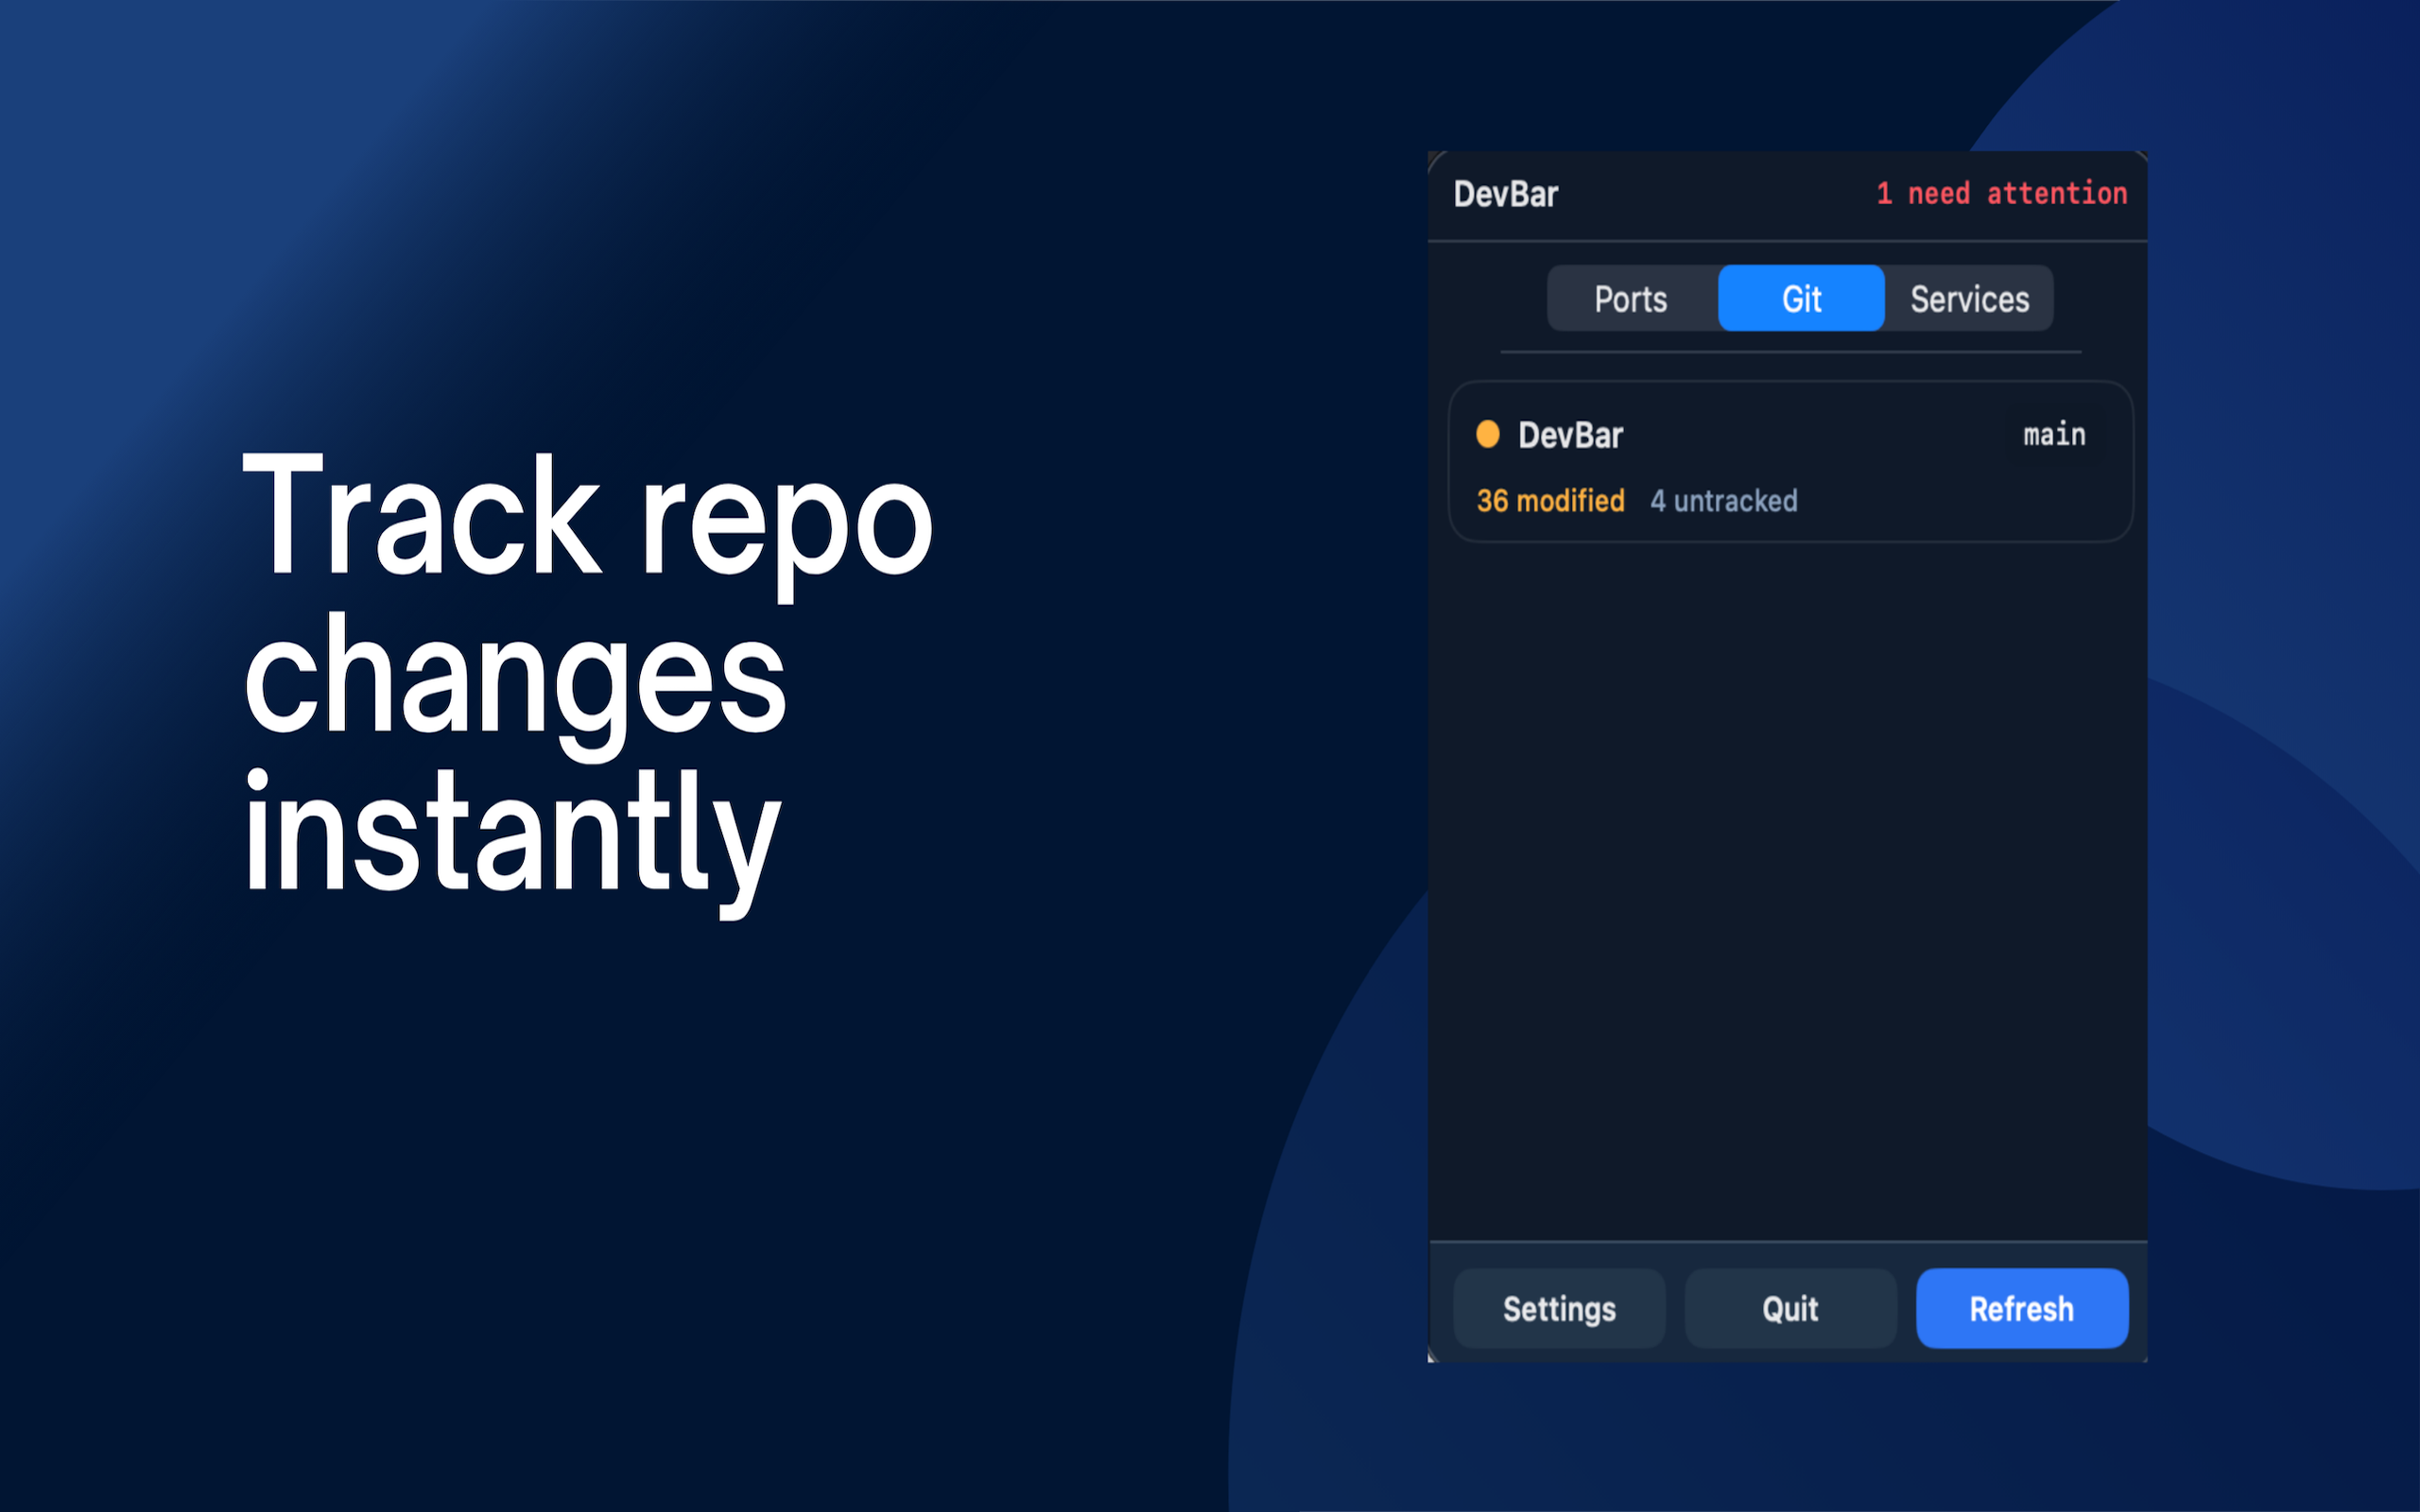
Git Repository Status ALL YOUR REPOS

DevBar watches all your git repositories at once. Uncommitted changes, commits ahead of remote, merge conflicts — surfaced immediately, without having to cd into every project folder.

  • Watch multiple repos simultaneously
  • Dirty working tree warnings
  • Ahead / behind remote tracking
  • Current branch shown at a glance
  • Open in Terminal or editor directly
DevBar git repository status panel
03 
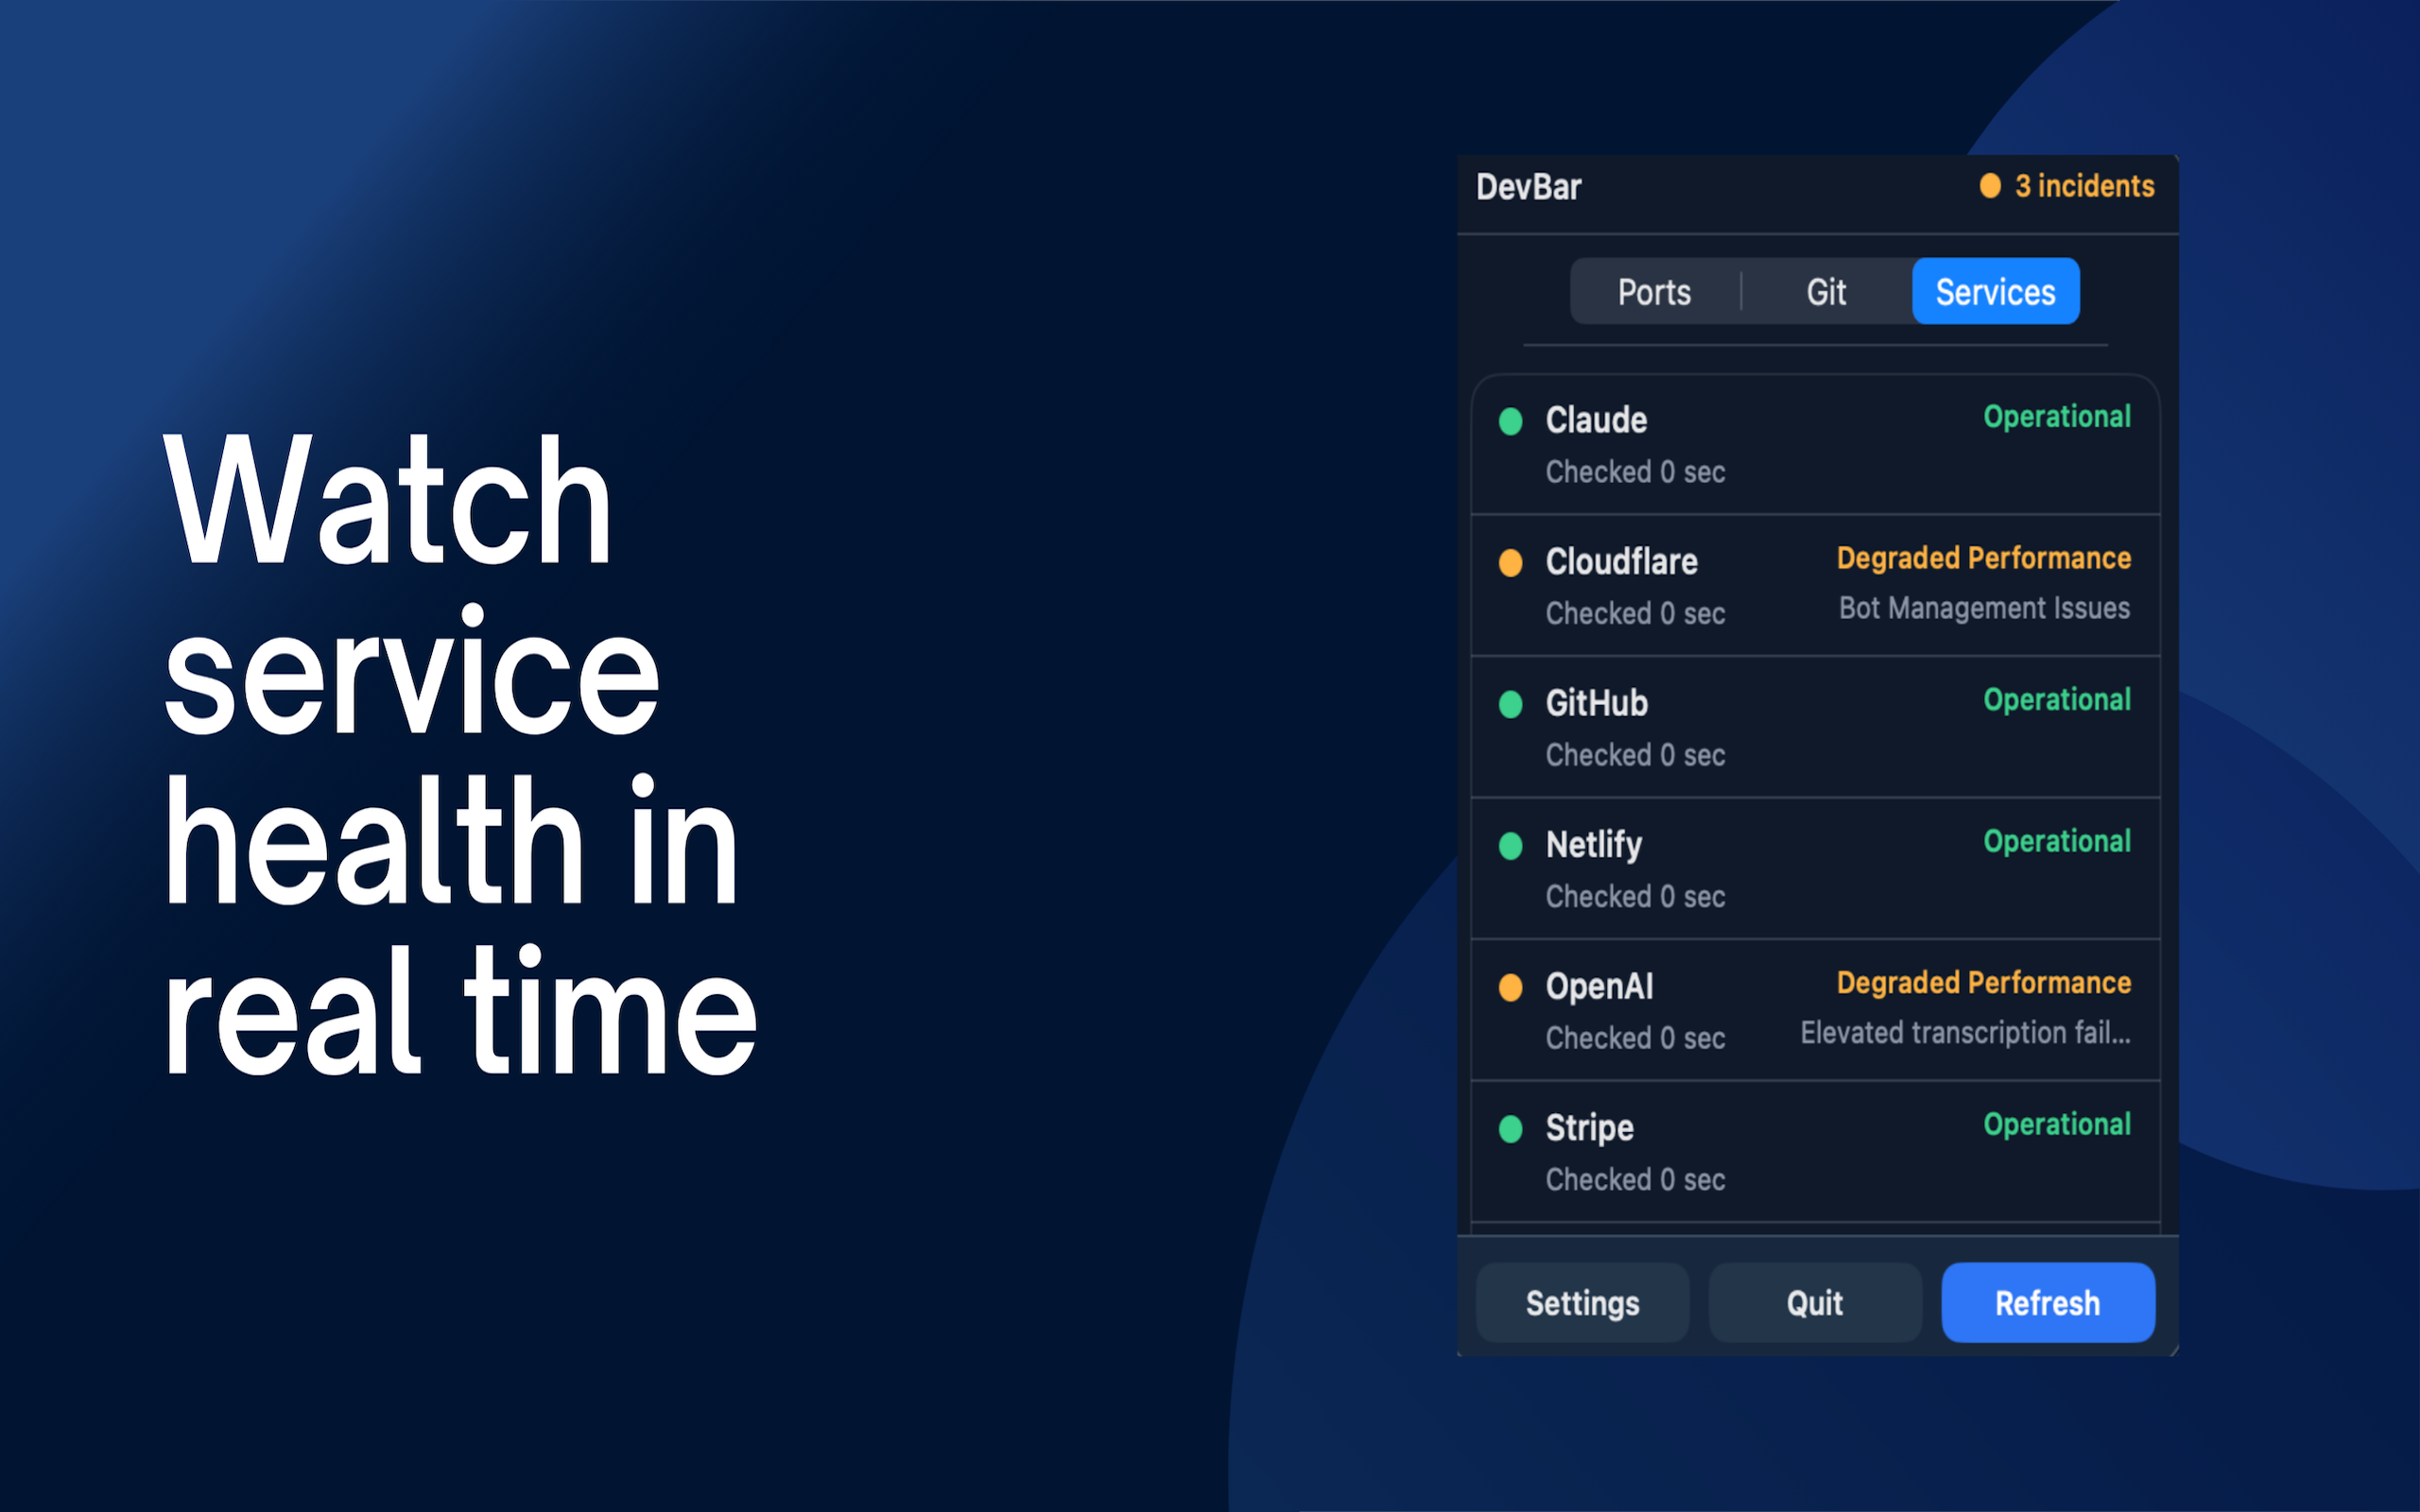
Service Health Monitor LIVE PING

Before you blame your code, know if GitHub is down. DevBar pings the services you depend on — GitHub, Vercel, Cloudflare, Supabase, and more — and shows you response time and status in real time.

  • GitHub, Vercel, Cloudflare, Supabase
  • Response time in milliseconds
  • Instant degraded / down detection
  • Custom services support
  • Menu bar badge on incidents
DevBar service health monitor
How it works

Click the icon.
That's the whole workflow.

// 01

Install. Sits in your menu bar.

DevBar installs like any Mac app and adds a single icon to your menu bar. No setup wizard, no account, no onboarding. Just a quiet icon waiting to be clicked.

// 02

Click to see everything.

One click opens a panel showing all active ports, your tracked repos, and service status — live, all at once. No switching between terminal tabs, GitHub status pages, or Git GUIs.

// 03

Act without leaving the panel.

Kill a port, open a branch in Terminal, or check if Vercel is actually down — all from the dropdown. Close the panel and get back to work in under 10 seconds.

Monitored services

The tools you ship with.
Watched automatically.

GitHub
Operational
API, Actions, Pages
Vercel
Operational
Edge network, builds
Cloudflare
Operational
DNS, Workers, CDN
Supabase
Operational
Database, auth, storage
Railway
Operational
Deployments, services
AWS
Operational
EC2, S3, Lambda
Render
Operational
Web services, crons
+ Custom URLs
Your own endpoints
Ping anything you want
Why DevBar

One tool.
Not three browser tabs.

Capability DevBar lsof / Terminal GitHub Status page
Always visible from menu bar One click Open Terminal each time Open browser each time
Kill a port without commands One click Find PID, then kill Not applicable
See all git repos at once All repos, live cd into each one Not applicable
Service health at a glance Pinged continuously Manual curl One service only
No subscription One-time purchase Free (manual) Free (browser)
Works offline Ports + git offline Requires internet
Get DevBar

Your dev environment,
always visible.

Available on the Mac App Store. One-time purchase. macOS 13 or later.

Download on Mac App Store
PRICING
$2.99
to start
One-time unlock · No subscription
Live localhost port scanner
Git repository status watcher
Service health monitoring
Native Swift — no Electron
macOS 13+ · Menu bar only
FOLLOW ALONG